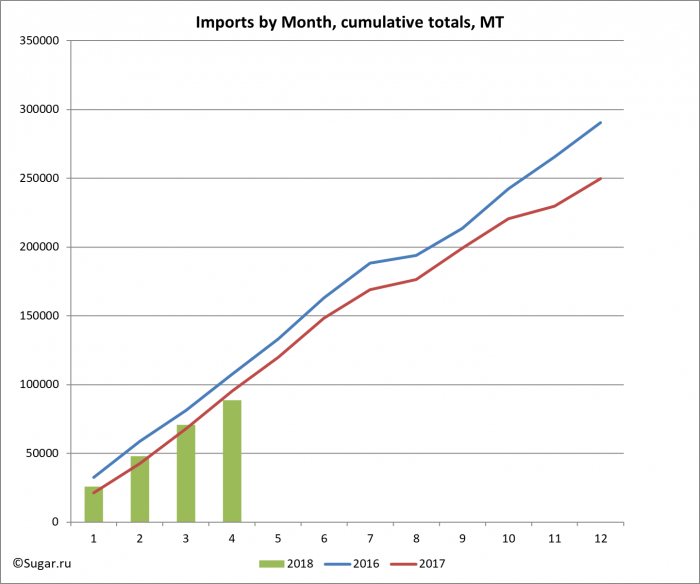
According to the analysis of customs declarations of FCS conducted by Sugar.ru, in April 2018 Russia has imported 17.9 thousand tons of white sugar. According to the results of 4 months of white sugar import campaign, Russia has shipped in 88.7 thousand tons (in 2017 - 95.3 thousand MT; in 2016 - 107.7 thousand MT).
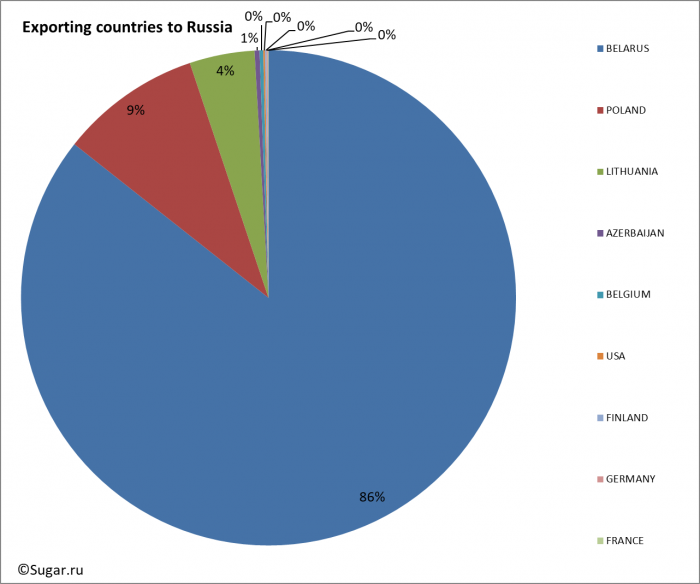
In the period January - April 2018, the main countries exporters of white sugar to Russia were BELARUS (85.65%) and POLAND (9.20%).
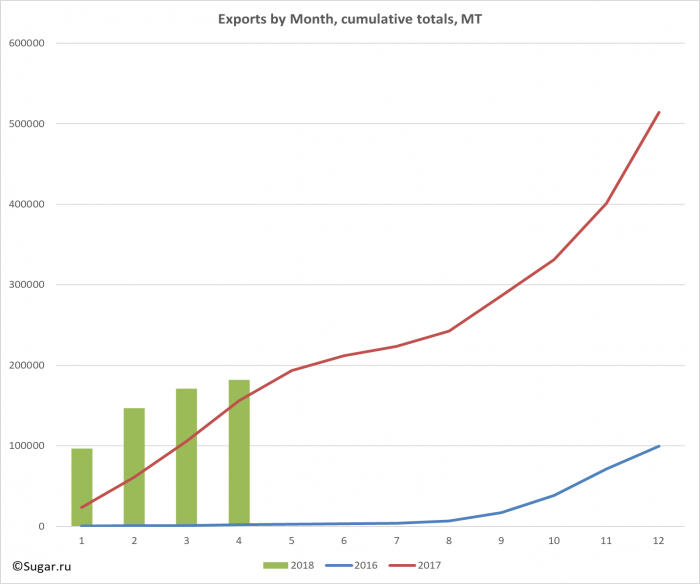
In April 2018 Russia has exported 182.1 thousand tons of white sugar. According to the results of 4 months of white sugar export campaign, Russia has shipped out 182.1 thousand tons (in 2017 - 156.2 thousand MT; in 2016 - 2.0 thousand MT).
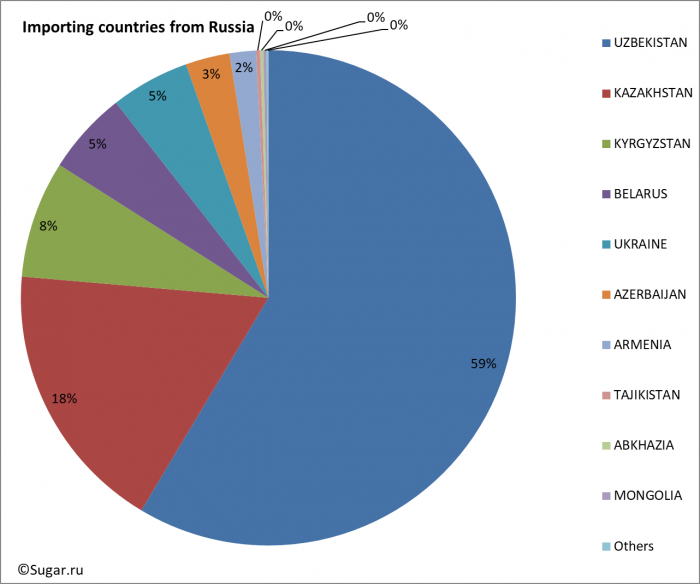
In the period January - April 2018, the main countries importers of white sugar from Russia were UZBEKISTAN (58.58%) and KAZAKHSTAN (17.79%)..
Tables:
- Countries – exporters of white sugar to Russia in January - April 2018, MT
- Countries – importers of white sugar from Russia in January - April 2018, MT
- Exports of white sugar to Russia by month, cumulative total, MT
- Imports of white sugar from Russia by month, cumulative total, MT
Countries – exporters of white sugar to Russia in January - April 2018, MT
| Exporting country to Russia, MT / year, month | 2016 | 2017 | 2018 | 2018 Total |
|||
| 1 | 2 | 3 | 4 | ||||
| BELARUS | 237637 | 205224 | 23037 | 19230 | 19718 | 13953 | 75938 |
| POLAND | 24878 | 28293 | 1981 | 1655 | 1661 | 2862 | 8160 |
| LITHUANIA | 10677 | 10708 | 638 | 1021 | 1148 | 957 | 3764 |
| AZERBAIJAN | 264 | 377 | 23 | 19 | 149 | 95 | 285 |
| BELGIUM | 493 | 484 | 39 | 118 | 41 | 14 | 212 |
| USA | 392 | 392 | 98 | 98 | |||
| FINLAND | 226 | 258 | 43 | 28 | 11 | 12 | 94 |
| GERMANY | 244 | 366 | 47 | 22 | 69 | ||
| FRANCE | 573 | 221 | 20 | 20 | 40 | ||
| THAILAND | 250 | ||||||
| CHINA | 20 | ||||||
| CZECH REPUBLIC | 250 | ||||||
| BRAZIL | 8289 | 540 | |||||
| TUNISIA | 25 | ||||||
| GEORGIA | 248 | ||||||
| MAURITIUS | 50 | 152 | |||||
| DENMARK | 80 | 20 | |||||
| KAZAKHSTAN | 6029 | 2552 | |||||
| UNITED ARAB EMIRATES | 25 | ||||||
| NETHERLANDS | 138 | ||||||
| Total | 290513 | 249862 | 25809 | 22090 | 22826 | 17935 | 88660 |
 |
Countries – importers of white sugar from Russia in January - April 2018, MT
| Exports from Russia (breakdown by importing countries), MT | 2016 | 2017 | 2018 | 2018 Total |
|||
| 1 | 2 | 3 | 4 | ||||
| UZBEKISTAN | 62 | 112310 | 74202 | 25921 | 6363 | 192 | 106679 |
| KAZAKHSTAN | 35348 | 105888 | 8913 | 12534 | 8116 | 2836 | 32399 |
| KYRGYZSTAN | 7691 | 24586 | 2873 | 3687 | 5264 | 2090 | 13914 |
| BELARUS | 2540 | 47171 | 3166 | 2679 | 1768 | 2280 | 9894 |
| UKRAINE | 8510 | 42099 | 1968 | 1847 | 2315 | 3247 | 9376 |
| AZERBAIJAN | 8128 | 114768 | 5255 | 13 | 5268 | ||
| ARMENIA | 1251 | 15912 | 98 | 3000 | 22 | 3120 | |
| TAJIKISTAN | 25625 | 26766 | 11 | 203 | 270 | 484 | |
| ABKHAZIA | 1054 | 1450 | 64 | 136 | 192 | 392 | |
| MONGOLIA | 1214 | 1402 | 199 | 10 | 30 | 130 | 369 |
| TURKMENISTAN | 1750 | 4405 | 134 | 68 | 201 | ||
| SOUTH OSSETIA | 635 | 700 | 15 | 15 | |||
| AFGHANISTAN | 3044 | ||||||
| SRI LANKA | 500 | ||||||
| EGYPT | 3924 | ||||||
| SERBIA | 1080 | 1608 | |||||
| CHINA | 169 | ||||||
| KOREA (DPRK) | 16 | 110 | |||||
| GEORGIA | 1110 | 4818 | |||||
| SYRIA | 6019 | ||||||
| Total | 99558 | 514104 | 96871 | 49839 | 24094 | 11305 | 182110 |
 |
Exports of white sugar to Russia by month, cumulative total, MT
| Exports by Month, cumulative totals, MT | 2016 | 2017 | 2018 |
| jan | 436 | 23661 | 96871 |
| feb | 758 | 60602 | 146711 |
| mar | 983 | 105878 | 170805 |
| apr | 2023 | 156155 | 182110 |
| may | 2753 | 193602 | |
| jun | 3163 | 212221 | |
| jul | 3957 | 223640 | |
| aug | 6451 | 242698 | |
| sep | 16784 | 286151 | |
| oct | 38429 | 331477 | |
| nov | 71203 | 401262 | |
| dec | 99558 | 514104 |
 |
Imports of white sugar from Russia by month, cumulative total, MT
| Imports by Month, cumulative totals, MT | 2016 | 2017 | 2018 |
| jan | 32641 | 21181 | 25809 |
| feb | 58683 | 42838 | 47899 |
| mar | 81159 | 67956 | 70726 |
| apr | 107655 | 95305 | 88660 |
| may | 133084 | 119930 | |
| jun | 163229 | 148325 | |
| jul | 188329 | 168932 | |
| aug | 193999 | 176528 | |
| sep | 213646 | 199344 | |
| oct | 242501 | 220471 | |
| nov | 265450 | 229582 | |
| dec | 290513 | 249862 |
 |
КОММЕНТАРИИ